
We all have our favourite locations around the UK that we would like to call home, but where are the most desirable places to live across the country?
We will be revealing the most in-demand areas of the UK by analysing factors such as average property price per local authority and how this has changed over time, the areas with the fewest number of properties for sale, and where people are looking to buy properties the most.
As well as this, we will be sharing some expert tips on making your property more appealing to potential buyers, which can be as simple as adding features such as roman blinds or a pair of elegant curtains.
The city of Glasgow is the most desirable place to live in the UK
Whether you’re staying in your local area or moving across the country, purchasing a new property is a big decision, and there are many factors that people take into consideration, such as property prices and how these have changed over time.
High property prices and fewer properties being available on the market can indicate that people are buying properties in the area at a quicker rate and residents are happy where they live and don’t want to move. But which areas of the UK and London are the most desirable to live in? Here’s what we found.
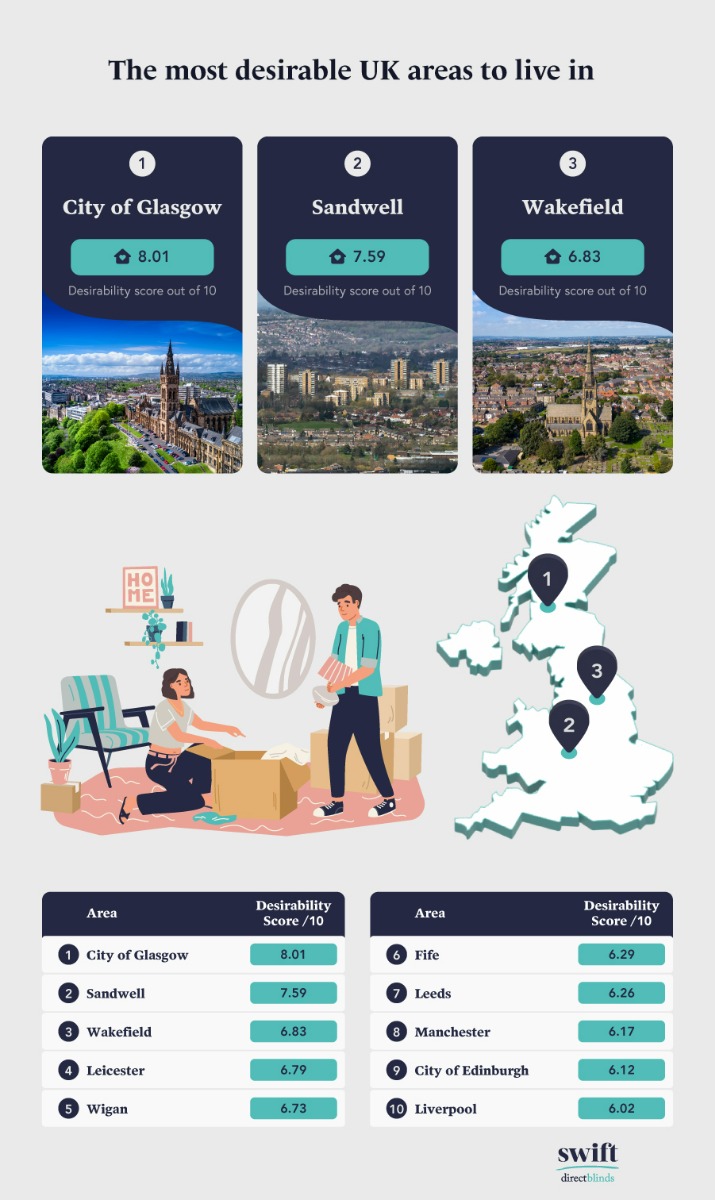
1. City of Glasgow - 8.01 desirability score
Glasgow is the most desirable place to live in the UK, achieving a desirability score of 8.01. In June 2023, the average price of a property in Glasgow stood at £173,259. This is an increase of 70.51% since June 2013 when the average house price stood at £101,615.
At the time of writing, there are currently 1,082 properties for sale in the city of Glasgow on Rightmove, equating to 170 properties per 100,000 people. In addition to this, between September 2022 and August 2023, over 18,600 searches were made on Google throughout the UK for “properties in Glasgow”.
2. Sandwell - 7.59 desirability score
In second place is Sandwell, which is located in the West Midlands and achieves a desirability score of 7.59. At the time of writing, there are 1,744 properties for sale in Sandwell on Rightmove, which equates to 510 properties per 100,000 people.
The average price of a property in Sandwell stood at £199,445 back in June 2023. This shows an increase of 85.43% over the last ten years, when the average house price stood at £107,560.
3. Wakefield - 6.83 desirability score
The third most desirable place to live in the UK is the city of Wakefield, which achieves a desirability score of 6.83. In June 2023, the average price of a property in Wakefield stood at £198,050. This is an increase of 67.88% since June 2013, when the average house price stood at £117,972.
At the time of writing, there are currently 507 properties for sale in Wakefield on Rightmove, equating to 143 properties per 100,000 people. In addition to this, between September 2022 and August 2023, almost 2,500 searches were made on Google throughout the UK for “properties in Wakefield”.
Waltham Forest is the most desirable London borough to live in
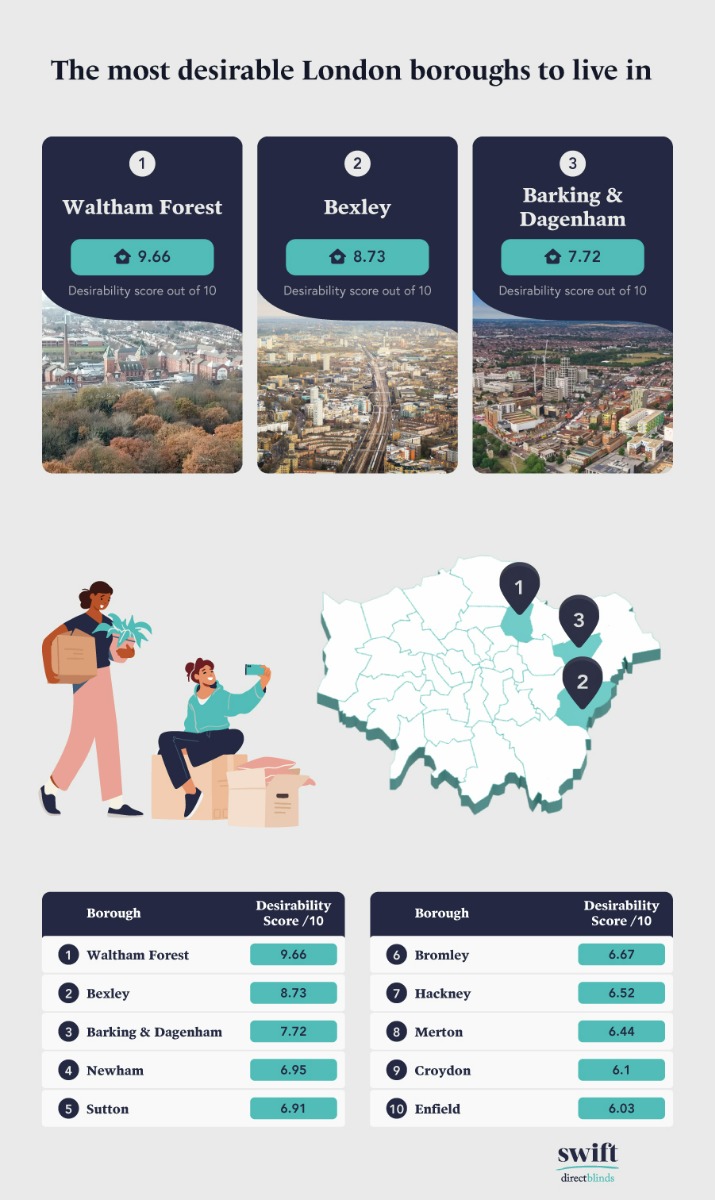
1. Waltham Forest - 9.66 desirability score
The most desirable London borough to live in is Waltham Forest, which achieves a desirability score of 9.66. At the time of writing, there are 1,274 properties for sale in Waltham Forest on Rightmove, which equates to 458 properties per 100,000 people.
The average price of a property in Waltham Forest stood at £506,476 back in June 2023. This is a huge increase of 101.11% over the last 10 years when the average house price stood at £251,846.
2. Bexley - 8.73 desirability score
In second place is Bexley, achieving a desirability score of 8.73. In June 2023, the average price of a property in Bexley stood at £296,025. This is an increase of 88.24% since June 2013, when the average house price stood at £210,388.
At the time of writing, there are currently 1,181 properties for sale in Bexley on Rightmove, equating to 479 properties per 100,000 people. In addition to this, between September 2022 and August 2023, over 2,000 searches were made on Google throughout the UK for “properties in Bexley”.
3. Barking & Dagenham - 7.72 desirability score
The third most desirable London borough to live in is Barking & Dagenham, which achieves a desirability score of 7.72. At the time of writing, there are 652 properties for sale in Barking & Dagenham on Rightmove, which equates to 298 properties per 100,000 people.
The average price of a property in Barking & Dagenham stood at £347,148 back in June 2023. This is a huge increase of 101.07% over the last 10 years when the average house price stood at £172,652.
Wigan is the area of the UK with the highest increase in average house prices over the last five years
Depending on your budget, average house prices in certain areas can greatly affect where you decide to buy a property. But which areas of the UK and London have seen the highest increase in average house prices over the last five and ten years? Here’s what we found.
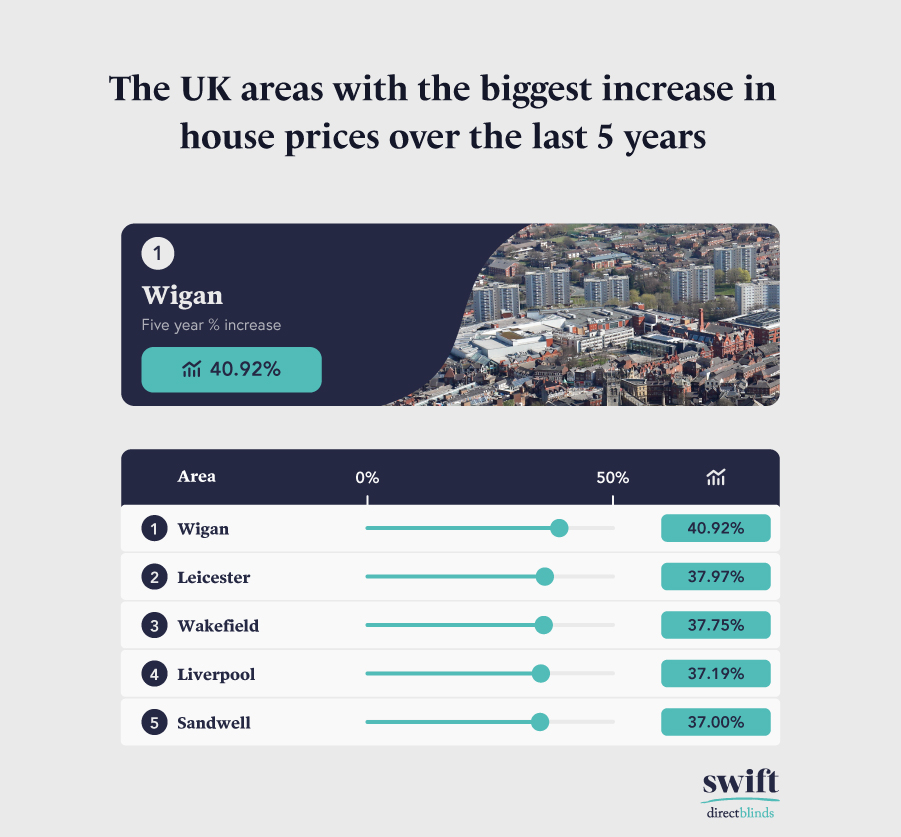
1. Wigan - 40.92% increase
The area of the UK that has seen the highest increase in average house prices over the last five years is Wigan. Back in June 2018, the average price of a property in the town stood at £129,632. By June 2023, this figure had risen to £181,676, showing an increase of 40.92%.
2. Leicester - 37.97% increase
In second place is the city of Leicester, where the average house price stood at £170,059 back in June 2018. By June 2023, this figure had risen to £234,633, which shows an increase of 37.97%.
3. Wakefield - 37.75% increase
Following closely behind is the city of Wakefield, where the average house price stood at £143,770 back in June 2018. By June 2023, this figure had risen to £198,050, showing an increase of 37.75%.
Barking & Dagenham is the London borough with the highest increase in average house prices over the last five years
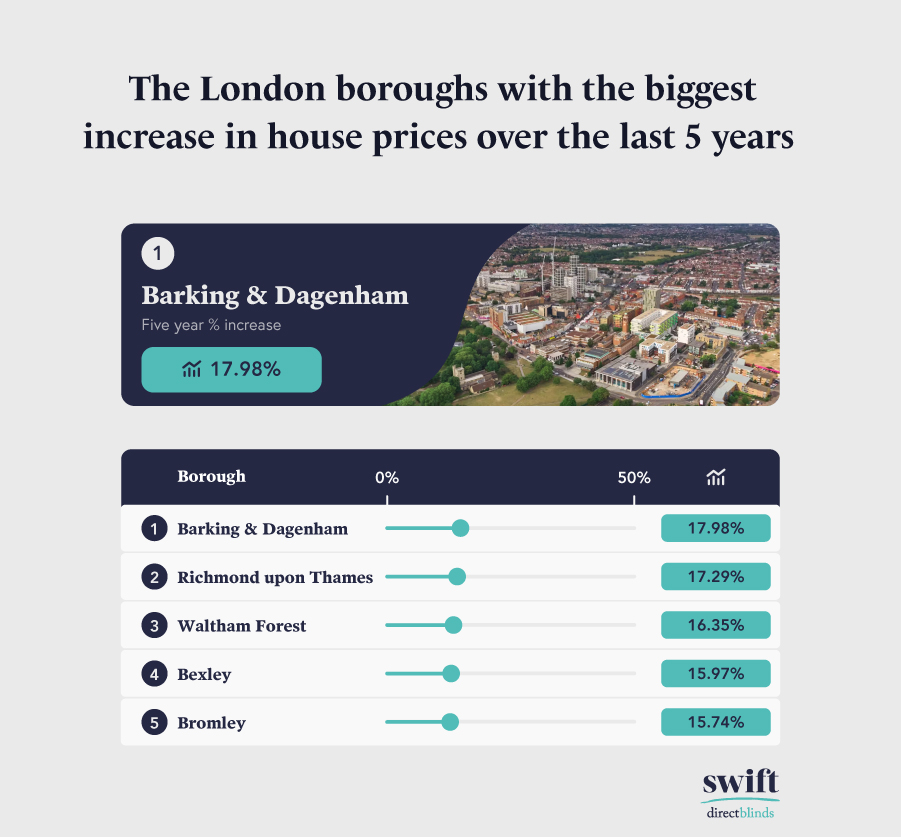
1. Barking & Dagenham - 17.98% increase
The London borough that has seen the highest increase in average house prices over the last five years is Barking & Dagenham. Back in June 2018, the average price of a property in the area stood at £294,236. By June 2023, this figure had risen to £347,148, showing an increase of 17.98%.
2. Richmond upon Thames - 17.29% increase
Following closely behind is Richmond upon Thames, where the average house price stood at £651,404 back in June 2018. By June 2023, this figure had risen to £764,021, which shows an increase of 17.29%.
3. Waltham Forest - 16.35% increase
In third place is Waltham Forest, where the average house price stood at £435,316 back in June 2018. By June 2023, this figure had risen to £506,476, showing an increase of 16.35%.
Manchester is the area of the UK with the highest increase in average house prices over the last 10 years

1. Manchester - 94.45% increase
The area of the UK that has seen the highest increase in average house prices over the last 10 years is Manchester. Back in June 2013, the average house price in the city stood at £119,951. By June 2023, this figure had risen to £233,243, which shows a considerable increase of 94.45%.
2. Leicester - 90.27% increase
In second place again is the city of Leicester, where the average house price stood at £123,315 back in June 2013. By June 2023, this figure had risen to £234,633, showing a considerable increase of 90.27%.
3. City of Bristol - 89.38% increase
Following closely behind is the city of Bristol, where the average house price stood at £183,224 back in June 2013. By June 2023, this figure had risen to £345,091, which shows a considerable increase of 89.38%.
Waltham Forest is the London borough with the highest increase in average house prices over the last 10 years
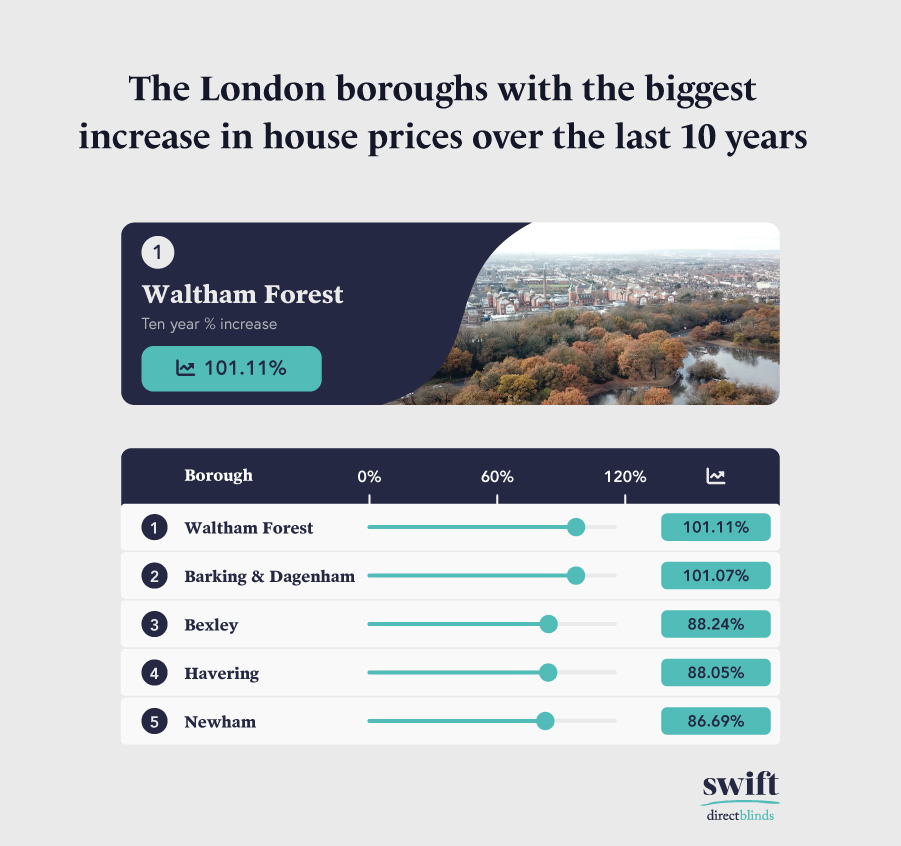
1. Waltham Forest - 101.11% increase
The London borough with the highest increase in average house prices over the last 10 years is Waltham Forest. Back in June 2013, the average house price in the area stood at £251,846. By June 2023, this figure had more than doubled to £506,476, showing a huge increase of 101.11%.
2. Barking & Dagenham - 101.07% increase
Following closely behind is Barking & Dagenham, where the average house price stood at £172,652 back in June 2013. By June 2023, this figure had more than doubled to £347,148, which shows a huge increase of 101.07%.
3. Bexley - 88.24% increase
In third place is Bexley, where the average house price stood at £210,388 back in June 2013. By June 2023, this figure had risen to £396,025, showing a considerable increase of 88.24%.
Buckinghamshire is the area of the UK with the highest mid-year average house price in 2023
House prices have fluctuated massively throughout 2023, and the UK property market is struggling due to things such as the cost of living and rising mortgage rates. However, the average house price is still remaining high in some areas, which suggests that the demand is still there. But which areas of the UK and London had the highest mid-year average house prices? Here’s what we found.
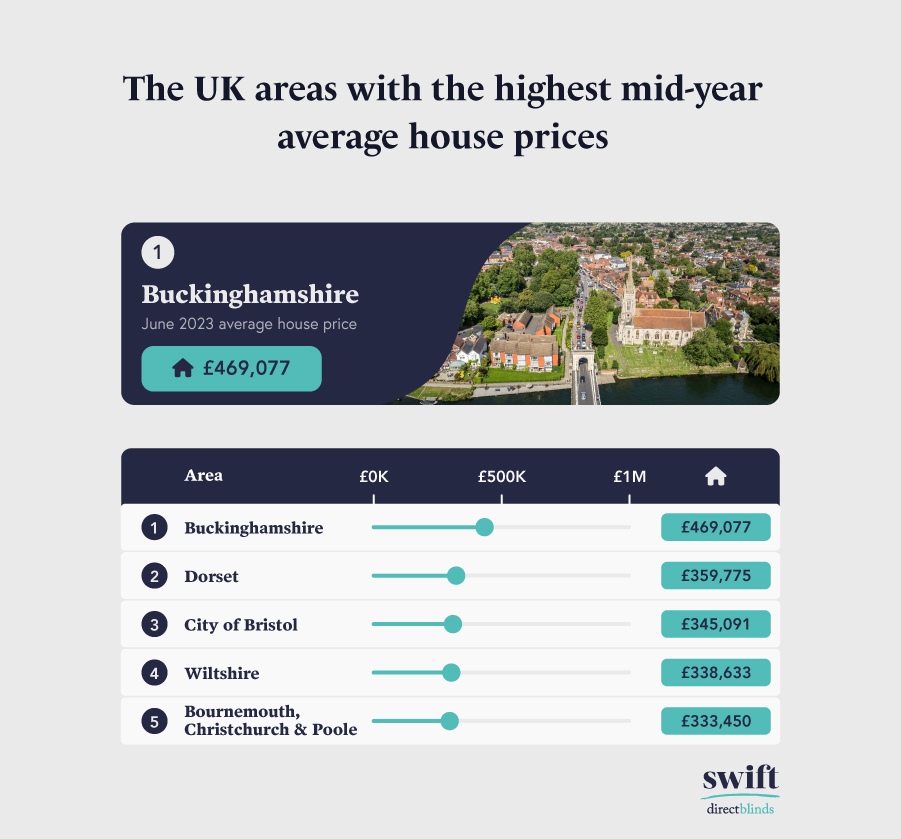
1. Buckinghamshire - £469,077 average house price in June 2023
The area of the UK with the highest mid-year average house price is Buckinghamshire. Back in June this year, the average house price in Buckinghamshire stood at £469,077, which is almost £110,000 more expensive than the area with the second-highest mid-year average house price.
2. Dorset - £359,775 average house price in June 2023
In second place is Dorset, where, in June this year, the average house price stood at £359,775. This is almost £15,000 more expensive than the area with the third-highest mid-year average house price.
3. City of Bristol - £345,091 average house price in June 2023
The area of the UK with the third-highest mid-year average house price is the city of Bristol. Back in June this year, the average house price in Bristol stood at £345,091, which is almost £6,500 more expensive than the area with the fourth-highest mid-year average house price.
Westminster is the London borough with the highest mid-year average house price in 2023
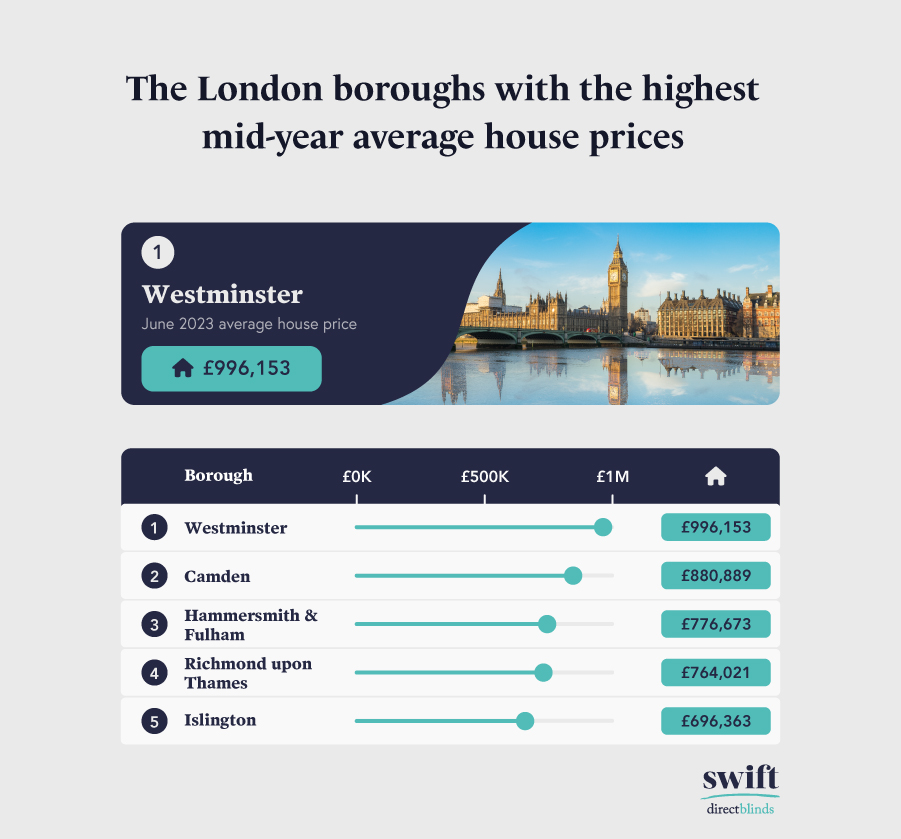
1. Westminster - £996,153 average house price in June 2023
The London borough with the highest mid-year average house price is Westminster. Back in June this year, the average house price in Westminster stood at a whopping £996,153, which is over £115,000 more expensive than the borough with the second-highest mid-year average house price!
2. Camden - £880,889 average house price in June 2023
In second place is Camden, where, in June this year, the average house price stood at a huge £880,889. This is over £104,000 more expensive than the borough with the third-highest mid-year average house price.
3. Hammersmith & Fulham - £776,673 average house price in June 2023
The London borough with the third-highest mid-year average house price is Hammersmith & Fulham. Back in June this year, the average house price in Hammersmith & Fulham stood at a huge £776,673, which is over £12,600 more expensive than the borough with the fourth-highest mid-year average house price.
Wigan is the area of the UK with the fewest properties currently for sale on Rightmove
Fewer properties being up for sale in a certain area can actually be a good sign, as it indicates that residents are happy where they live and don’t want to move. It also suggests that any properties that are put on the market are being snapped up quickly due to it being such a desirable area. With that in mind, which areas of the UK and London have the fewest properties currently for sale on Rightmove? Here’s what we found.
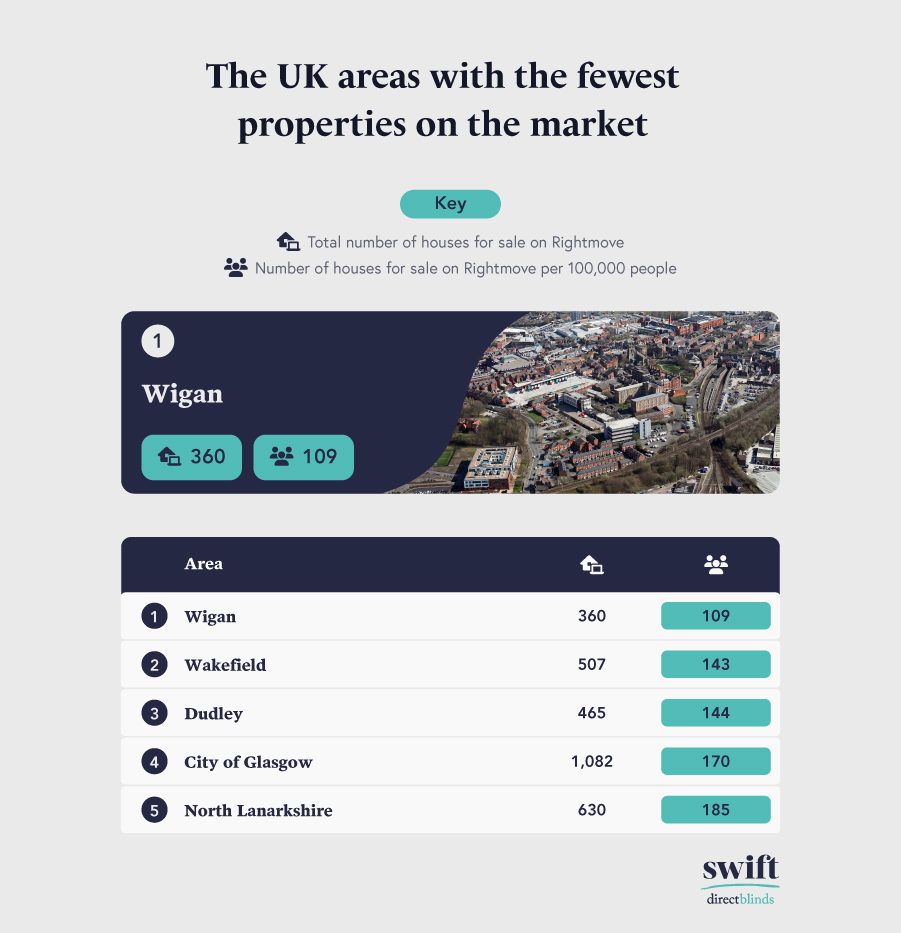
1. Wigan
● Number of properties for sale on Rightmove per 100,000 people - 109
● Total number of properties for sale on Rightmove - 360
The area of the UK with the fewest properties currently for sale on Rightmove is Wigan, where, at the time of writing, there are currently 360 properties for sale on Rightmove. This equates to 109 properties per 100,000 people.
2. Wakefield
● Number of properties for sale on Rightmove per 100,000 people - 143
● Total number of properties for sale on Rightmove - 507
In second place is Wakefield, where, at the time of writing, there are currently 507 properties available in total, equating to 143 properties per 100,000 people.
3. Dudley
● Number of properties for sale on Rightmove per 100,000 people - 144
● Total number of properties for sale on Rightmove - 465
The area of the UK with the third-fewest properties for sale on Rightmove is Dudley. There are currently 144 properties for sale on Rightmove, which equates to 144 properties per 100,000 people.
Barking & Dagenham is the London borough with the fewest properties currently for sale on Rightmove
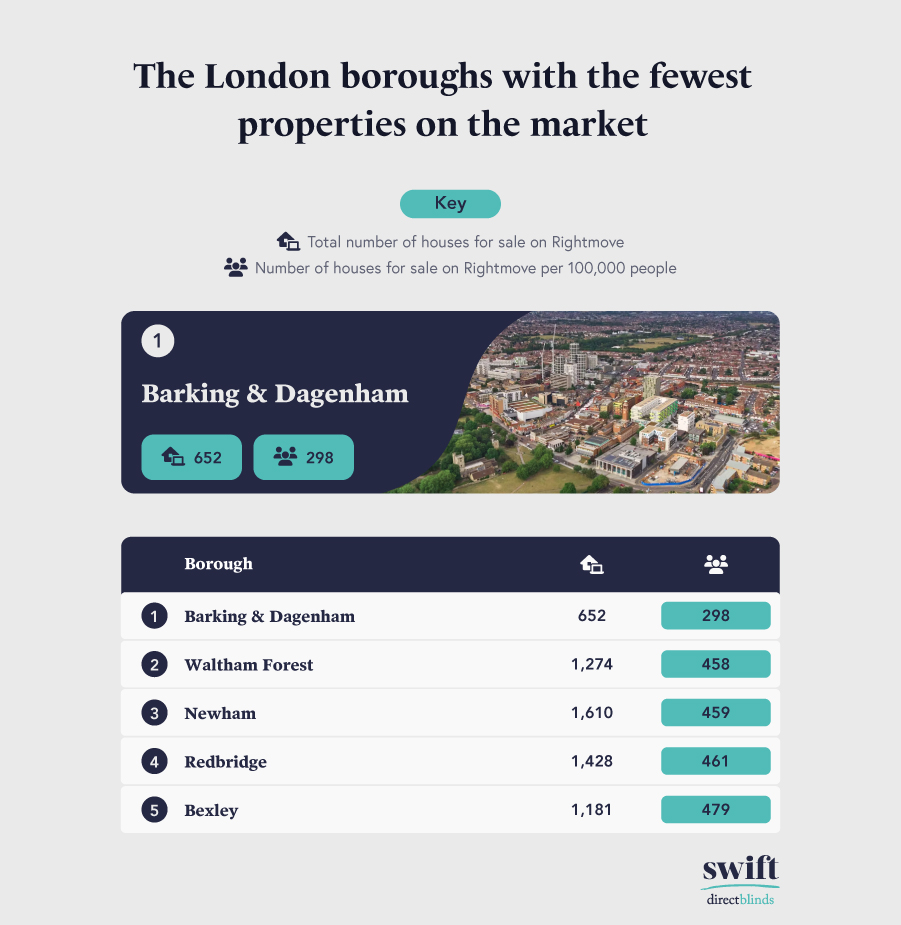
1. Barking & Dagenham
● Number of properties for sale on Rightmove per 100,000 people - 298
● Total number of properties for sale on Rightmove - 652
The London borough with the fewest properties currently for sale on Rightmove is Barking & Dagenham. At the time of writing, there are currently 652 properties available in total, equating to 298 properties per 100,000 people.
2. Waltham Forest
● Number of properties for sale on Rightmove per 100,000 people - 458
● Total number of properties for sale on Rightmove - 1,274
In second place is Waltham Forest, where there are currently 1,274 properties for sale on Rightmove at the time of writing. This equates to 458 properties per 100,000 people.
3. Newham
● Number of properties for sale on Rightmove per 100,000 people - 459
● Total number of properties for sale on Rightmove - 1,610
The London borough with the third-fewest properties currently for sale on Rightmove is Newham. At the time of writing, there are currently 1,610 properties available in total, equating to 459 properties per 100,000 people.
UK residents have been searching for properties in the area of Fife the most within the last year
Buying a new property involves carrying out a lot of extensive research; Google really does become your best friend! But which areas of the UK and London are being searched for the most when it comes to property-related searches? Here’s what we found.
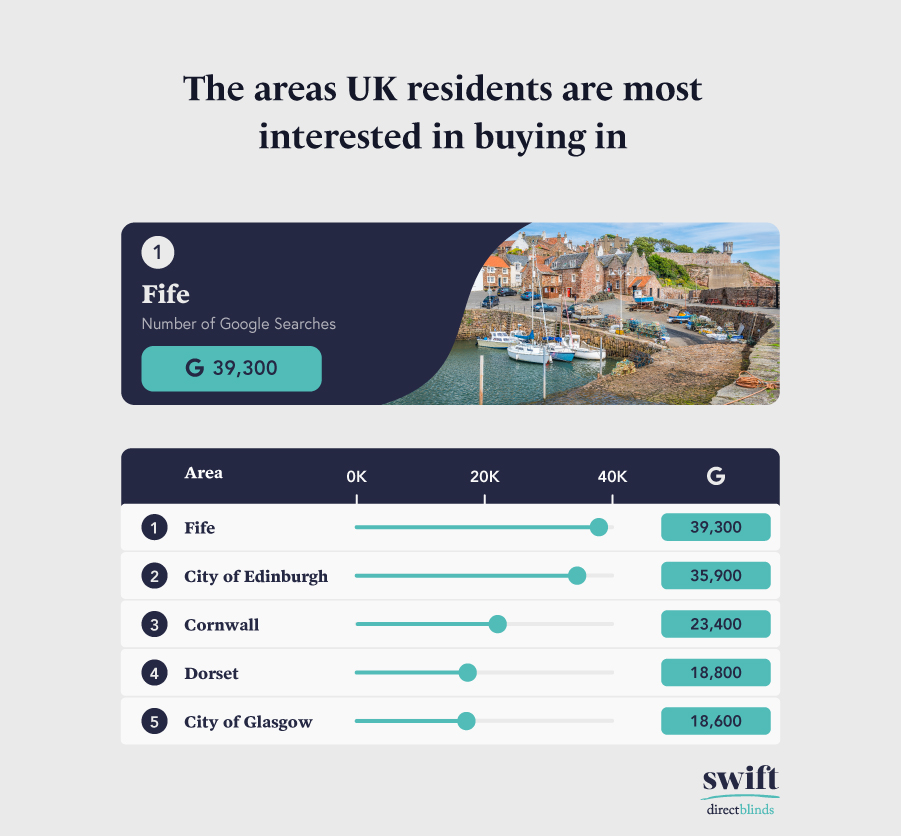
1. Fife - 39,300 Google searches
The area of the UK that appears in the most property-related searches is Fife. Between September 2022 and August 2023, there were over 39,300 searches on Google for the term “properties in Fife”.
2. City of Edinburgh - 35,900 Google searches
In second place is the city of Edinburgh, which garnered over 35,900 searches on Google for the term “properties in Edinburgh” between September 2022 and August 2023.
3. Cornwall - 23,400 Google searches
The area of the UK with the third-highest number of property-related searches is Cornwall. Between September 2022 and August 2023, there were over 23,400 searches on Google for the term “properties in Cornwall”.
UK residents have been searching for properties in the Islington borough of London the most within the last year
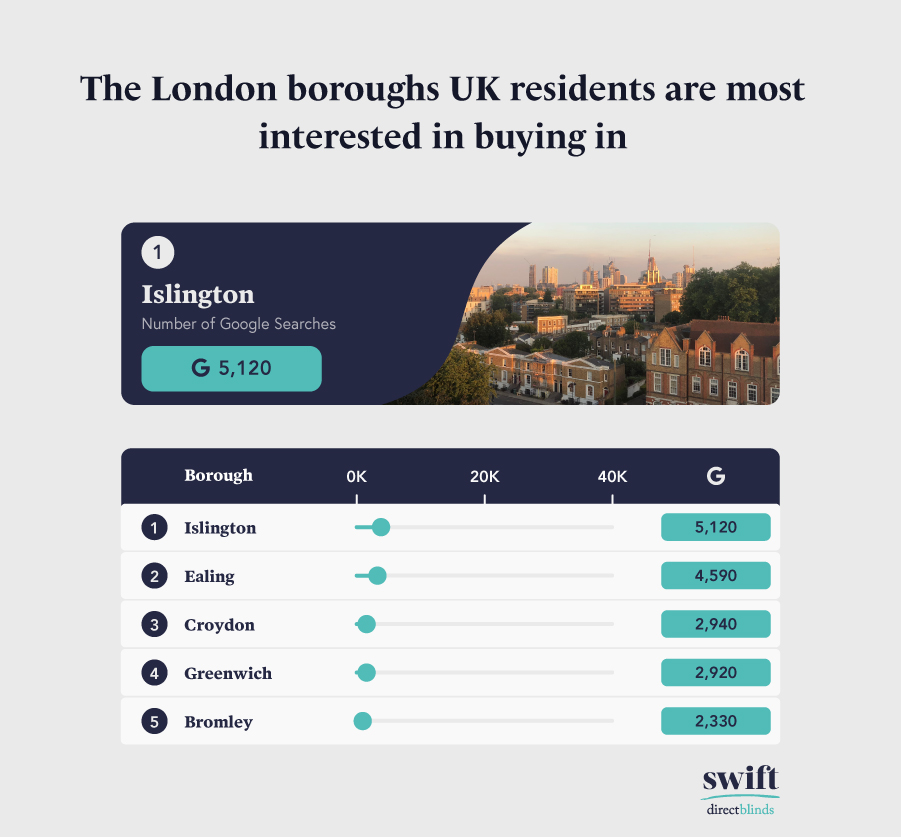
1. Islington - 5,120 Google searches
The London borough that appears in the most property-related searches is Islington. Between September 2022 and August 2023, there were over 5,120 searches on Google for the term “properties in Islington”.
2. Ealing - 4,590 Google searches
In second place is Ealing, which garnered over 4,590 searches on Google for the term “properties in Ealing” between September 2022 and August 2023.
3. Croydon - 2,940 Google searches
The London borough with the third-highest number of property-related searches is Croydon. Between September 2022 and August 2023, there were over 2,940 searches on Google for the term “properties in Croydon”.
3 tips on how to make your property more appealing to potential buyers
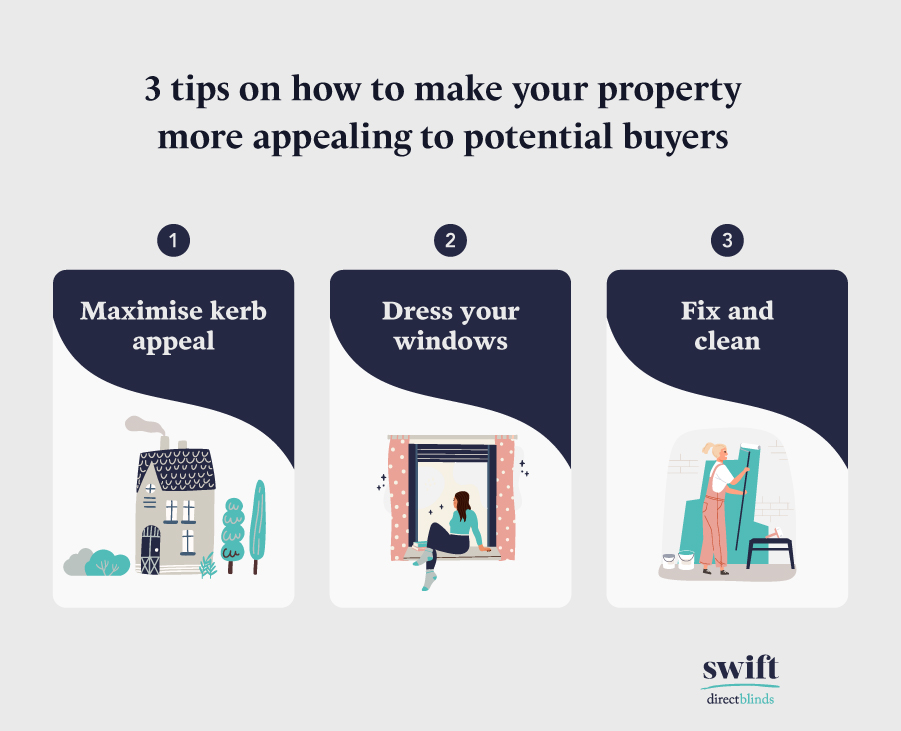
1. Maximise kerb appeal
One of the first things that a potential buyer sees when viewing a house is the outside of the property. This first glimpse can create a lasting impression, and most buyers tend to make up their minds within the first few minutes of arriving at a property. What creates kerb appeal will differ depending on the buyer, but one of the most important features is well-maintained windows, which means no visible signs of rot or flaking paint.
It is also important to have a well-maintained roof with no missing tiles or other visible signs of damage. A high-quality roof that is in good condition will put the potential buyer's mind at ease when it comes to things such as dampness or leaks. This also extends to the front garden, driveway or path of a property. It’s important to keep these areas well-maintained by eliminating weeds, trimming hedges and ensuring the ground isn’t worn down.
2. Dress your windows
One really simple way to make your property more appealing to any potential buyers is to properly dress your windows. ‘Naked’ windows can make a house appear to be impersonal and run down, but this can be fixed by simply adding blinds or curtains. Endless options are available, from colour, style and solution to material, performance and type. Neutral colours such as white, grey and cream have proven very popular this year and will also enable potential buyers to imagine how they would adapt the room to their needs.
Roller blinds are arguably the easiest type of blind to install and are a simple yet effective choice. They are available in a whole host of colours, patterns and fabrics and can even be made from a moisture-resistant material for use in bathrooms and kitchens. Wooden blinds are also becoming increasingly popular, as they allow homeowners to control how much light is allowed into the room. They also come in a range of colours and materials, such as faux wood, matt wood, gloss wood and fine grain. For any large areas, vertical blinds are a great option and they are even available in blackout fabric for bedrooms or waterproof fabric for bathrooms and kitchens.
Blackout curtains are a great choice for bedroom windows, as they effectively block any light from entering the room and can also reduce noise levels so that you are able to get a peaceful night’s rest. Thermal curtains are ideal for the windows in any room where you have trouble maintaining the temperature, as they provide excellent insulation, allowing the room to remain warm throughout winter but cool throughout summer.
You can get more information about current blind and curtain trends in the UK here.
3. Fix and clean
Putting your property on the market is a great opportunity to finally get around to doing those little jobs that you’ve been putting off for months. Most buyers ideally want to move into a house without having to do a lot of work, so see this as an opportunity to make any minor repairs, such as fixing holes in walls or cracks in tiles. It’s also a great time to have any worn carpets removed and replaced too.
In addition to this, no matter what time of the year it is, ensure that you are carrying out a big spring clean of the property. This involves carrying out tasks such as getting rid of any limescale in the bathroom or kitchen, waxing any wooden floors, and eliminating any bad odours left by pets or damp.
Methodology
We began by using the Office for National Statistics website to gather the population figures for all local authorities throughout the entirety of the UK and each of the London boroughs. We then narrowed this down to the top 30 most populated London boroughs and top 30 most populated areas of the wider UK.
We then used data from the Land Registry to discover the average house price in each of the local authorities and boroughs in June 2013, 2018 and 2023. We used this data to calculate the five and 10-year percentage increases in average house prices.
Next, we used Rightmove to discover how many properties were currently for sale in each local authority area or borough. All types of properties were included, with the exclusion of land sales. We then used this data and the population figures for each area and borough to calculate how many properties were available per 100,000 people. All data was collected on 15 September 2023 and may now differ.
We then used Google Keyword Planner to discover how many searches had been made for “properties in XX” between September 2022 and August 2023 for each area and borough. No data was available for Sandwell, Brent, Waltham Forest, Merton or Hammersmith & Fulham. The names of some areas were adjusted slightly to allow us to collect data, e.g. for the Bournemouth, Christchurch & Poole area, we used the term “properties in Bournemouth”.
Finally, we ranked the five and 10-year percentage increases, the number of properties available on Rightmove per 100,000 people and the number of Google searches, giving each a normalised score out of 10, before taking our final overall score as an average across all four factors and ranking each local authority and borough accordingly. For the Rightmove data, we considered fewer properties being available as a sign that residents are happy where they are living and that properties are being purchased at a fast rate.
North Northamptonshire, West Northamptonshire and East Cheshire were removed from the ranking because three data points were unavailable. These were then replaced by the next three most populated local authorities: Shropshire, Dudley and South Lanarkshire. Belfast was also removed from the ranking due to Rightmove not being widely used in Northern Ireland.